How Thermal Mapping Server Cabinets Can Reduce Energy Costs
Whether you operate a small server room or a large data centre, your biggest operating cost will be electricity. The energy used to not only power your servers and IT network but for the cooling, uninterruptible power supplies, lighting, and any other electrical devices within your facility.
With the price per kWh of electricity continuing to rise, it can be worthwhile, even for a small data centre to model its energy usage and look for ways to reduce consumption. For larger IT facilities, the modelling may be continuous using algorithms and artificial intelligence to identify trends, areas for improvement and forecasting potential savings.
What is Energy Modelling?
Energy modelling is a process that takes data gathered from environmental sensors and through analysis, provides a real time view. For a server room or data centre environment, most data collected is for temperature and humidity, along with power usage in terms of Amps (A), mains supply voltages (V), Watts (W); The electrical factors allow calculations of the VA and Watts being drawn by the individual systems and the overall facility. VA and Watts are normally quoted in kVA or kW (1,000 VA unit) measurements. For large datacentres, the measures may be in MVA or MW (1,000 kVA unit) factors. From this energy usage consumption can be calculated in terms of the kW used per hour (Kilo-Watt Hours).
Power Usage Effectiveness (PUE)
Most server room and data centre environments use the Green Grid metric known as PUE. This is a ratio of the energy used to power the IT load to the total energy used for the building. The nearer the metric is to 1 (Unity) the more efficient the data centre. Large data centre operators such as Google achieve 1.10 and even as low as 1.06 but these figures are typically not attainable for most operators.
More info: https://www.google.co.uk/about/datacenters/efficiency
Having a PUE for your server room or data centre allows benchmark comparison with other facilities and a baseline to monitor how effective (or not) energy improvement plans are.
Server Cabinet Temperature and Humidity Data Collection
Cooling accounts for almost 50% of the energy costs in typical server room and data centre environments. Monitoring temperature and humidity related data can provide important data with which to assess how effective the air conditioning or other cooling solutions are, and model them for future program changes including upgrades to critical systems and server rack layouts.
The recommended approach for a server cabinet is to install sensors at the front and rear of the cabinets, including the top, middle and bottom. This means ideally you should have a set of six sensors per cabinet and from these data can be collected to monitor the incoming and exhaust air flow and provide a basis for Delta-T (the difference between two points).
Data collected in this way can provide alarm indications if the data strays outside of pre-set tolerances. It provides inputs for modelling data centre cooling efficiency and couple with power related data, energy usage. This allows for ‘What If’ scenarios to model changes and test within the model before physical changes are made.
How to Generate Server Cabinet Thermal Maps
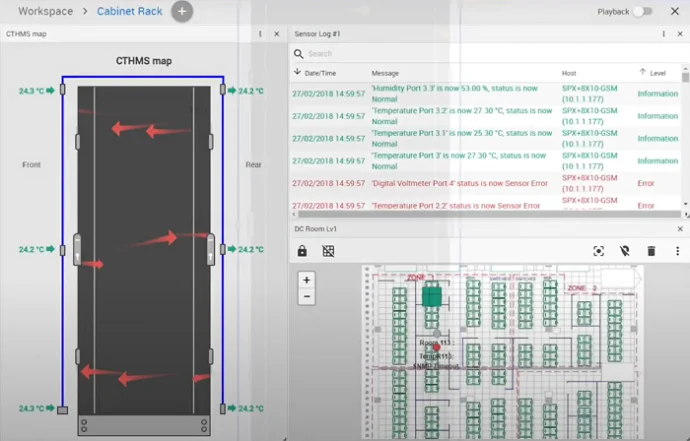
Thermal maps for server cabinets require three elements. The first is the installation of AKCP Thermal Map Sensors which consist of 6 temperature sensors connected into a string. Two further humidity sensors can also be connected to provide a complete temperature and humidity view of a server cabinet. The sensors are supplied ready to attach to the server cabinet(s) with magnetic, cable ties, or ultra-high bond adhesive tape to hold them in position.
The sensors are then connected to a suitable environment monitoring base unit such as the sensorProbe X+ SPX8. The SPX8 can connect to eight sensor strings as standard, allowing the sensors from up to eight cabinets to be connected the base unit. Further ports can be added to connect to sixteen sensor strings. Multiple sensorProbe X+ base units can also be installed to gather data from all the server cabinets to be monitored.
The final component is software-based. AKCPro Software reads the data collected by the sensorProbe X+ units to provide visual displays including the server cabinet thermal maps.
The Advantages of Server Cabinet Thermal Map Sensors
Whether monitoring one or two high-compute racks in a data centre or rack aisle across a data center estate, there are several advantages to using thermal map sensors.
- Remove Obstructions: poor air flow can result from several factors within a server rack. Poorly installed equipment, cabling and a lack of blanking panels, can lead to a drop in server rack air pressures and recirculating air flow where cool and warm air mixes. Hot-spots can also occur which can be a sign of equipment ageing and potential future failure.
- Quickly Identify Fan Failures: most cooling fans are speed-temperature variable and will require future replacement and are consumable items. Fan speeds can slow as fans age, leading to poor air flow and increasing temperatures within a cabinet.
- Quickly Identify Pressure Drops: airflow is related to the differential pressure between the front and rear of a server cabinet. A drop in air flow pressure will lead to less cool air flowing from the front of the cabinet to the rear.
- Continuous Power Usage Effectiveness (PUE) Measurement: collecting in-line power meter data via an environment monitoring base station can provide the data required for continuous PUE calculation, allowing adjustments to be made in real-time their effectiveness immediately assessed. Suggested changes can also be made in Colo data centre environments, where clients manage their own racks.
AKCPro Software provides a DCIM solution for data centre manages who want to manage their data centre facility. As well as thermal maps, the software provides drill down mapping, graphing and VPN connection to remote sites.
Summary
Server rack temperature and humidity monitoring is a general requirement for any IT server environment. Using the data can provide alarms and insights into how effectively the environment is cooled. Thermal maps take this data to a new level, allowing energy modelling and a more complete picture of what is happening inside a server cabinet. For data centre operators ten or more server cabinets, thermal maps can be an invaluable tool that can reduce energy costs and improve overall energy efficiency. Not only can this lead to lower electricity bills but a more environmentally friendly facility with a lower PUE ratio.Please contact our Projects Team to arrange a demonstration of the software we use for server cabinet thermal mapping or arrange a site survey.


